The share of your budget spent on land decides how much building you can afford, and therefore how much rent the asset can earn. This guide sets out corridor benchmarks, a break-even sensitivity analysis, the approvals that protect your land investment, and the due diligence behind each decision.
Key takeaways
- Land should ideally be 14% to 22% of total turnkey budget; above 30%, net yields compress unless vertical density rises.
- Moving land from 22% to 30% of a KES 150M budget cuts affordable floor area by about 11% at the same unit cost.
- Ruaka, Gacharage, and Kikuyu pair lower land bases with deep tenant demand compared with core nodes.
- Approvals and due diligence protect the land investment: a stalled site earns nothing.
Analyzing High-Growth Corridors: Why Ruaka and Nairobi’s Outer Ring Are Outperforming Core Nodes
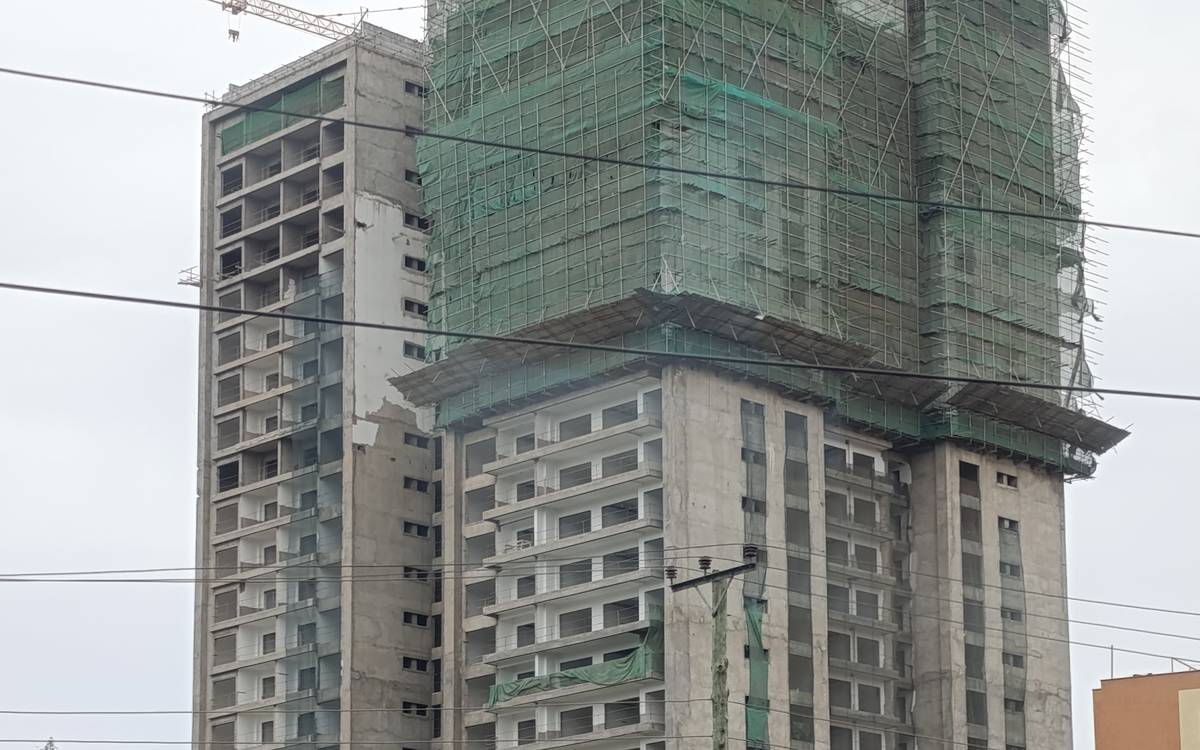
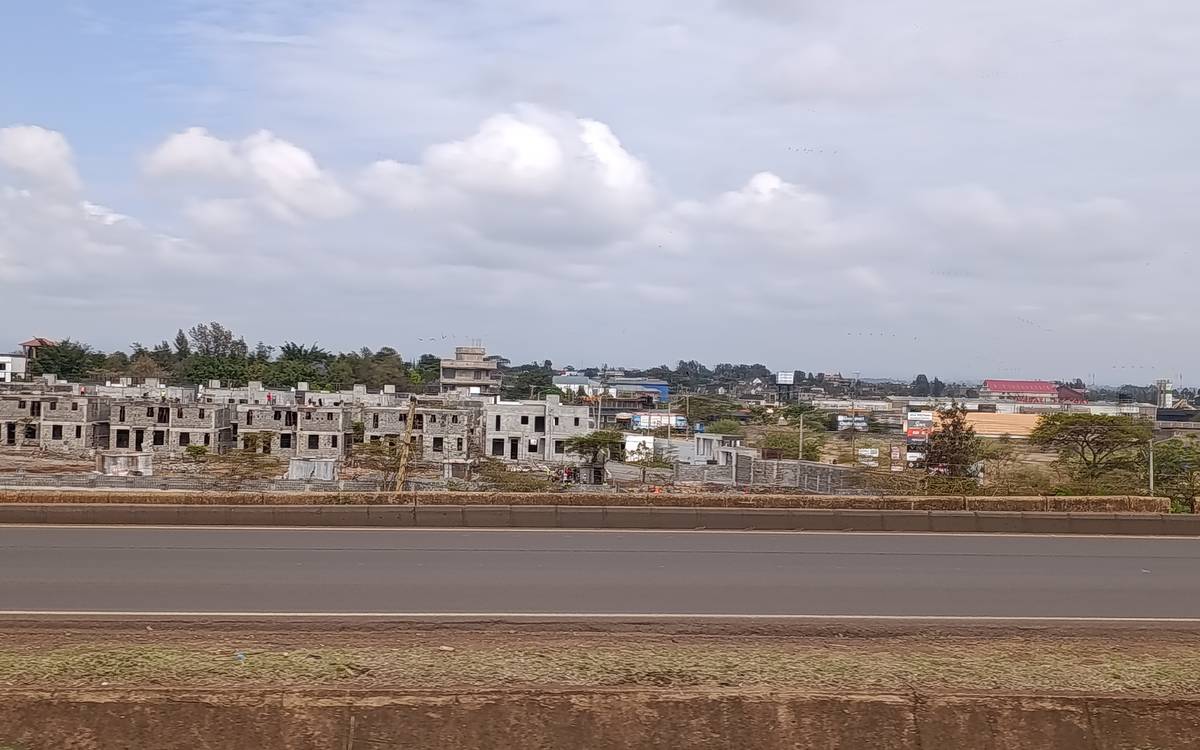
Core nodes such as Westlands command premium rents, but they also demand premium land. When land absorbs a large share of the budget, the remaining construction capital buys less lettable space, and yield falls. Outer-ring corridors reverse this: lower land bases, cost-efficient build rates, and a deep pool of commuters priced out of the core.
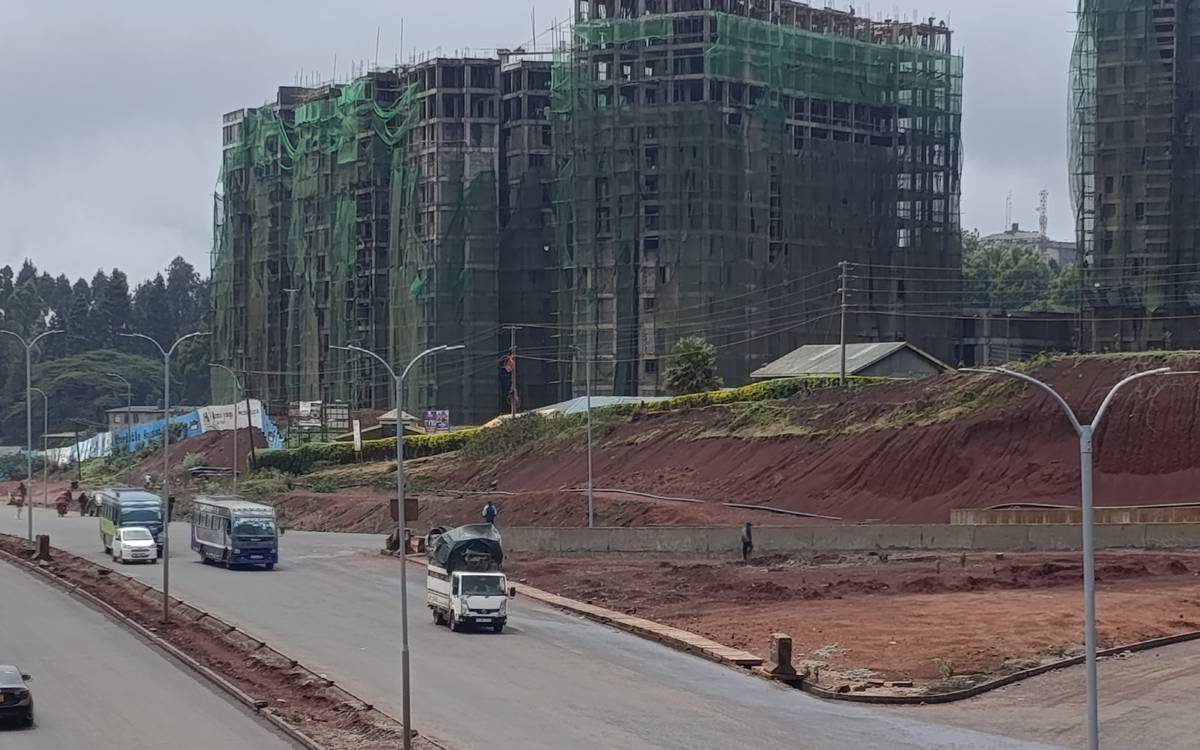
Infrastructure is the second driver. The Limuru Road, Northern Bypass, and Western Bypass links have shortened commutes into employment hubs, pulling tenant demand outward. Build rates in our model also vary by corridor, from about KES 42,000 per square metre in Limuru to about KES 46,500 in Ruaka, so a lower land base is often paired with a lower cost to build. Yields in this guide are net annual income as a share of total capital deployed, covering land, approvals, and construction.
On our corridor benchmarks, Ruaka plots trade around KES 40 million to 55 million with modelled net yields of 12.2% to 14.1% and appreciation near 11.8% a year. Gacharage plots sit nearer KES 15 million to 24 million, with yields of 12.8% to 14.6%. Kikuyu spans KES 18 million to 35 million or more, at 12.1% to 14.4%. These are indicative benchmarks, not fixed quotes, and each site must be verified individually.
For the location-versus-capital logic behind these numbers, see our analysis of apartment investment and land economics in Nairobi.
| Corridor | Typical plot cost | Avg. rental yield | Appreciation | Occupancy |
|---|---|---|---|---|
| Ruaka | ~KES 40M – 55M+ | 12.2% – 14.1% | 11.8% p.a. | 96.8% |
| Gacharage | ~KES 15M – 24M | 12.8% – 14.6% | 13.4% p.a. | 95.2% |
| Banana | ~KES 20M – 32M | 12.0% – 13.8% | 11.2% p.a. | 96.0% |
| Ndenderu | ~KES 18M – 28M | 12.5% – 14.3% | 12.9% p.a. | 95.6% |
| Kikuyu | ~KES 18M – 35M+ | 12.1% – 14.4% | 12.0% p.a. | 96.2% |
| Limuru | ~KES 12M – 22M | 12.0% – 13.9% | 12.4% p.a. | 94.2% |
The Economics of Plot Development: Calculating the Break-Even Point on Multi-Floor Apartments
Total project cost is land, plus approvals and professional fees (modelled at 6.5%), plus hard construction cost. Simple payback is total cost divided by net annual income. Because income scales with lettable floor area, the land share of the budget is the lever that moves payback most.
Take a KES 150 million budget at Ruaka’s modelled build rate of KES 46,500 per square metre. Our simulator example for a mixed-use block, with land at the simulator’s 32% Ruaka ceiling, returns a net yield of 13.7%, about KES 20.6 million a year, and a payback of roughly 7.3 years. Now vary the land share while holding the budget and the unit cost constant.
The practical consequence is a unit count. At a 22% land share the budget supports roughly 2,306 square metres, or about 30 apartments at a 62 square metre average unit and 82% efficiency. At a 38% land share it supports about 1,790 square metres, or roughly 24 apartments. Six fewer rentable units on the same capital is the cost of overpaying for land.
The sensitivity assumes rent per square metre is unchanged, which isolates the land effect. It shows why our land guidance is a ceiling-and-target discipline: aim for 14% to 22% of total turnkey budget, and treat higher shares as justified only where taller density compensates.
| Land share of budget | Land (KES M) | Build capital (KES M) | Buildable area (sqm) | Area vs. 22% base | Payback vs. 22% base |
|---|---|---|---|---|---|
| 14% | 21.0 | 119.3 | 2,565 | +11% | About 10% shorter |
| 18% | 27.0 | 113.3 | 2,435 | +6% | About 6% shorter |
| 22% (base) | 33.0 | 107.3 | 2,306 | Base | Base |
| 30% | 45.0 | 95.3 | 2,048 | -11% | About 12% longer |
| 38% | 57.0 | 83.3 | 1,790 | -22% | About 28% longer |
Regulatory Approvals & Technical Compliance: Protecting Your Land Investment from Costly Stalls
Land is only worth what you can legally build on it. A stalled site earns nothing while still carrying financing, security, and opportunity cost, which is why approvals belong in the feasibility model, not after it. County architectural and structural approvals, NEMA environmental licensing, and NCA registration typically take 6 to 12 weeks combined, or 10 to 14 weeks where a change of use is required, and we run technical detailing in parallel to save time.
Technical compliance goes beyond permits. Sewer line capacity, three-phase power, road-reserve setbacks, and soil bearing capacity all determine whether the approved design can be built at the budgeted cost. Pre-purchase geotechnical trial pits and utility verification routinely prevent surprises that would otherwise appear as substructure variations, and gentle-gradient plots with shallow rock or murram can save millions in retaining walls and drainage.
Our Approvals & Technical Works package also optimizes the design for the plot, targeting an 82% to 86% net-to-gross floor plate efficiency, because every recovered square metre improves the land-to-build ratio. Requirements vary by county and project category, so confirm current thresholds with each authority.
| Approval | Authority | Risk if missing |
|---|---|---|
| Building plan approval and change of user | County planning department | Stop-work orders and enforcement |
| Environmental impact assessment | NEMA | Licence conditions and project suspension |
| Contractor and project registration | NCA | Non-compliant works and penalties |
| Borehole and water permits | WRA | Unlawful abstraction |
| Occupation certificate | County authority | Unable to let or sell units |
Market Due Diligence Frameworks: How Patment Invest Verifies Viability Before a Shilling is Deployed
Our Market Due Diligence audit runs over two to three weeks and tests six things: corridor yield comparison, highest-and-best-use typology, the ten-year zoning and land-use trajectory, competing stock and absorption, a ten-year discounted cashflow with sensitivities, and the management-ease brief for operations.
Land is then priced backwards. Land Sourcing calculates the maximum residual land value from the completed building’s rental income, verifies title, beacons, road reserves, soil conditions, and utilities, and only then negotiates. The result is a plot that fits the model rather than a model forced to fit a plot.
Finally, the exit strategy is modelled before land is bought. Build-to-rent, build-to-sell through sectional titles, and hybrid structures each produce different cash profiles, and the plot’s size, frontage, and zoning must suit the chosen route. Locking this in at feasibility stage means the design, approvals, and marketing plan all point at the same outcome.
You can test your own numbers with the return simulator on our Ruaka corridor page, which is pre-set to that corridor’s benchmarks.
Frequently asked questions
What is the ideal land-to-total-cost ratio in Kenya?
For apartment blocks and commercial plazas we target land at 14% to 22% of total turnkey budget. Above 30%, net yields compress significantly unless vertical density is increased.
Should I buy land first or study the numbers first?
Study the numbers first. A feasibility model defines the plot size, zoning, and price that fit your target return, so you buy land that suits the project.
Do these corridor figures apply to Kiambu generally?
They are benchmarks for the specific corridors listed. Plot-level factors such as frontage, zoning, soil, and utilities can move the numbers either way, so each site needs its own verification.
Next Step: Validate Your Land-to-Build Ratio Before You Commit Capital
The right land-to-build ratio is not a rule of thumb; it is the output of a model that reflects your corridor, typology, and exit. Getting it right before purchase is the cheapest decision in the project.
Share your target corridor and budget, and we will test it against our benchmarks, approvals pipeline, and demand data. For how the build is then delivered, read our guide to turnkey construction versus fragmented contracting.
Request a Confidential Land & Corridor Feasibility Review: tell us your plot or target corridor and we will model the land-to-build ratio and yield.